About the Research
What Are Ecological Indicators?
In cases where there are insufficient species data to guide conservation efforts, scientists can develop indicators to fill information gaps. These indicators act as surrogates that provide a “best guess” in the absence of data on the species or group of interest. Indicators use environmental or species information that can be easily accessed and is available over large geographic areas.
Satellite Imagery Cannot Discern All Resources and Habitat Features That Are Important for Bees
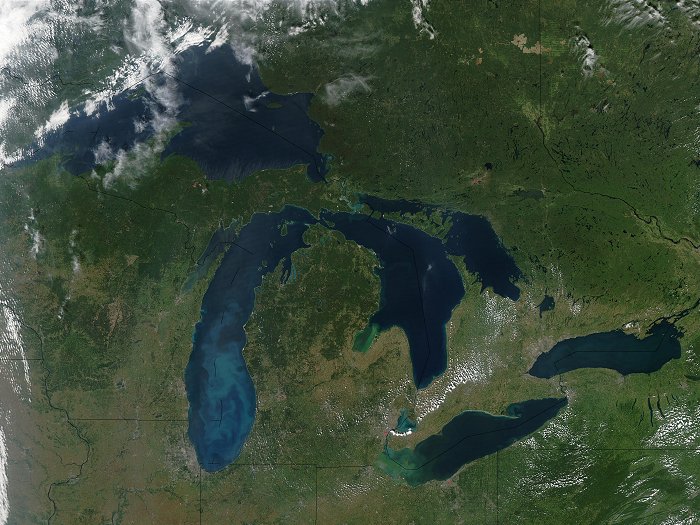
Environmental data include satellite data that capture the habitat or land cover types associated with a particular species or group. One disadvantage of remotely sensed data is that they may miss important habitat attributes or resources that bees need.
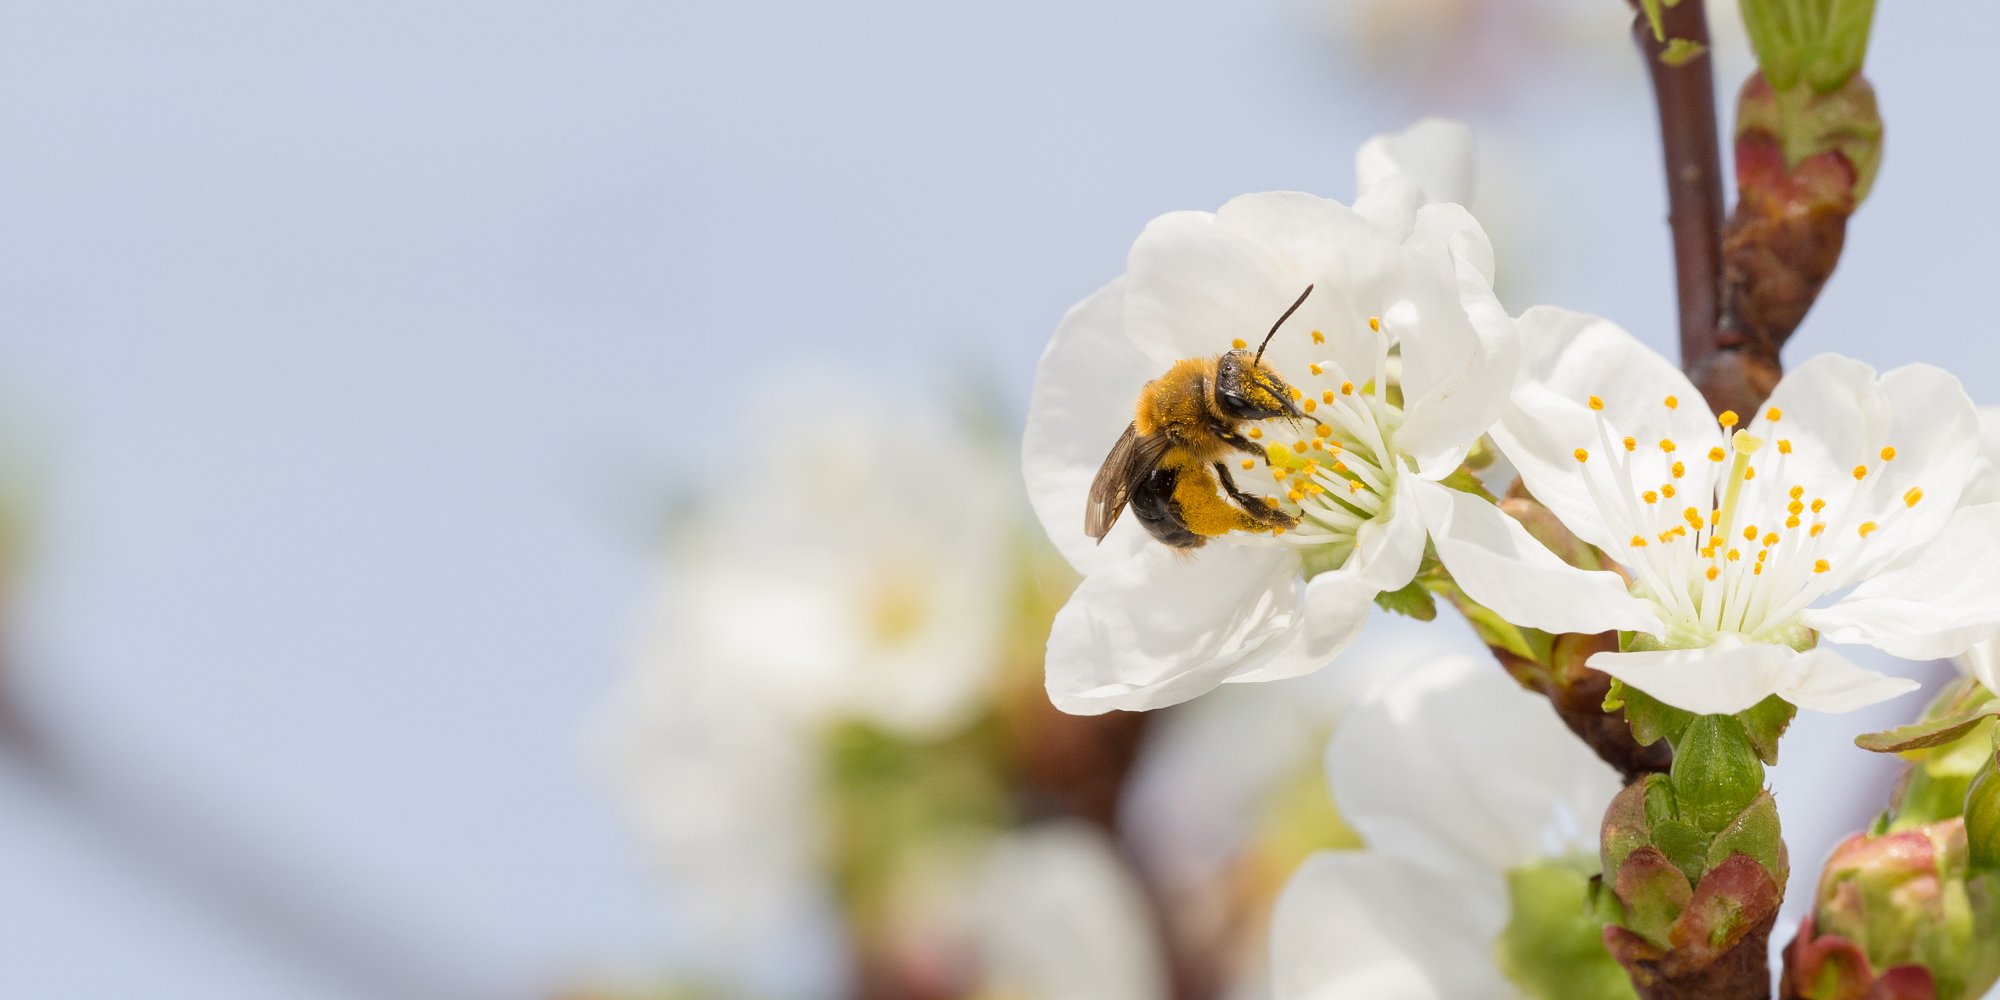
Wild Bee Needs
Wild bee species, for example, may require certain flowering plants for food or may need specific forest or soil conditions for nesting that are not well captured by a habitat category (like an “urban” or “oak savanna”).
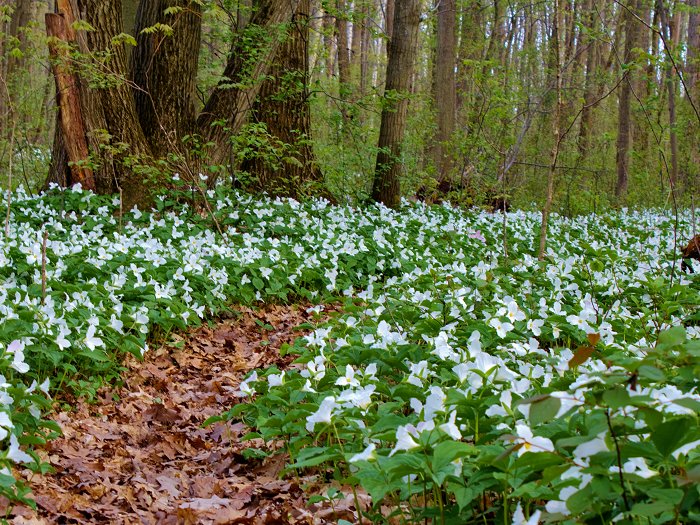
Birds and Bees Respond to Local and Landscape Features
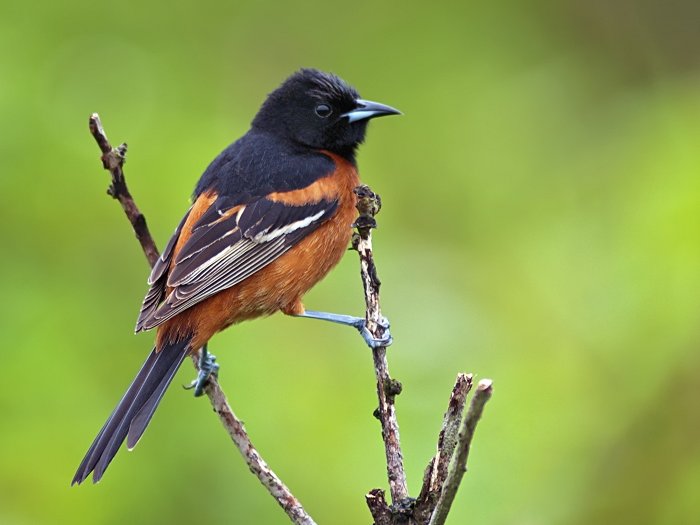
The Orchard Oriole is one species whose presence is positively related to the number of bee species. This association makes sense because Orchard Orioles eat insects, berries, and nectar and use semi-open habitats like orchards, riparian forests, forest edges, and prairie woodlands that also provide resources to bees.
Species also can be used as indicators because their presence or abundance can tell us about the habitat or resources at a particular location. Birds are especially amenable because many bird species are sensitive to environmental conditions, require specific habitats or resources, and are easily surveyed.
You can think of ecological indicators as providing evidence-based “best guesses” that can help to guide conservation in the absence of bee data. Please consult with regional or local experts and/or use local data sources whenever possible. In addition, please support bee monitoring programs and the important work of experts who study and conserve bees.
Our Approach
We developed an indicator to predict the number of wild bee species in the eastern and central U.S. using a combination of remotely-sensed land cover data and participatory science data on birds (eBird). For detailed information on our methodology, please see our paper.
Bee Data
Species richness of bees was estimated using data from Chesshire et al. (2023), supplemented with 2021 records from the Global Biodiversity Information Facility and Symbiota Collections of Arthropods Network (SCAN). All data were subject to review, checks, filters, and species name validations. Records with only one bee, as was the for most iNaturalist submissions, and 3×3 km grid cells with only one survey or <30 bee records. For each cell, we calculated the average number of species per survey as a standardized metric of bee richness. We also used a high-quality bee dataset to provide an additional validation of our methods. We selected this dataset by using only high-quality bee data from USGS Bee Lab that contained protocol and effort information and could be standardized as the number of bee species per trap hour (instead of per surveys as above). We also limited the temporal range to five years (2011 to 2015) and the geographical extent to a few states in eastern U.S.
Bird Data
We used data from eBird, a global participatory science project housed at the Cornell Lab of Ornithology. Volunteers – also called eBirders – submit bird observations and checklists, which are subjected to rigorous review and statistical procedures to ensure data quality. Data scientists and statisticians at the Cornell Lab analyze those data to produce estimates of bird relative abundance and population trends.
Learn More About eBird:
- What is eBird and how to contribute to it
- Browse the population status and trends of species and explore science and applications
- How eBird data is collected and analyzed
We used data from the eBird Basic Dataset (2022), which consists of bird species checklists submitted by volunteers and reviewed by experts. We selected checklists that would provide us the best information to help track the number of bee species. These were checklists collected by experienced observers during the breeding season (mid-May to mid-August) using stationary or traveling protocols lasting 5 to 300 minutes and providing counts of each species. We avoided using bird species that were uncommon or had limited geographic distribution. We ran statistical models to estimate where each bird species was more (or less) abundant than expected. We tested a total of 79 bird species to explore their ability to predict bee species richness.
Modeling in a Nutshell
Methodology

Modelling Methodology
(A) We considered bird species and land cover, to predict bee richness.
(B) We used field data from two bee datasets – semi-structured and structured datasets and summarized them over 3×3 km grid cells, across the eastern and midwestern U.S.
(C) We compared three sets of variables – land cover only, birds only, and birds and land cover.
(D) For each set of variables, we created 100 sub-models using a Bayesian variable selection process. We considered model fit and validation to identify the set of variables that best-predicted bee richness. We statistically compared model fit, for each dataset.
Predicted Bee Richness
We predicted bee richness within each 3×3 km grid cell (n = 2585 with both bird and bee data) using data from 79 birds and 21 land-cover variables. We used a Bayesian modeling process and data-quality controls to select predictors of bee richness using predictors that were: (a) exclusively land cover categories, (b) exclusively bird data, or (c) a combination of land-cover and birds. After running sub-models – 100 each for these three sets of predictor variables – we averaged across the 100 sub-models to generate 3 different predictions of bee richness for each grid cell and assessed the accuracy with a five-fold cross-validation process. Models using the combination of birds and land cover data performed best and were used in subsequent steps. Because we lacked field data for birds and bees at every location in the study region, we generated predictions of wild bee richness based on land cover data and bird abundance (eBird Status Data Products).
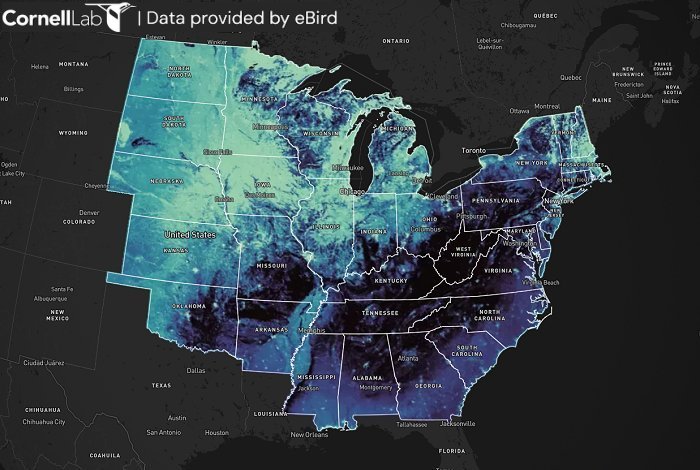
Map 1: Predicted Wild Bee Richness:
This map shows the predicted number of wild bee species (bee richness) in the eastern and central U.S. In areas with high predicted* bee richness, extra care should be taken to protect habitats and resources used by bees, reduce threats like pesticides, and/or engage others in bee conservation activities. Keep in mind that areas predicted to have low bee richness may support species of conservation concern and may have potential for habitat restoration or other measures to support bees.
(View interactive map on Wild Bee Diversity Prediction Tool page)
Uncertainty
We then calculated 90% confidence intervals around each prediction and created an estimate of scaled uncertainty at each location. This methodology was repeated with a subset of high-quality USGS bee data from 2011-2015 that contained protocol and effort information and could be standardized as the number of bee species per trap hour (instead of per surveys as above). This allowed us to assess if our results would hold across datasets with different structures and assess the impact of changes in data quality and study extent.
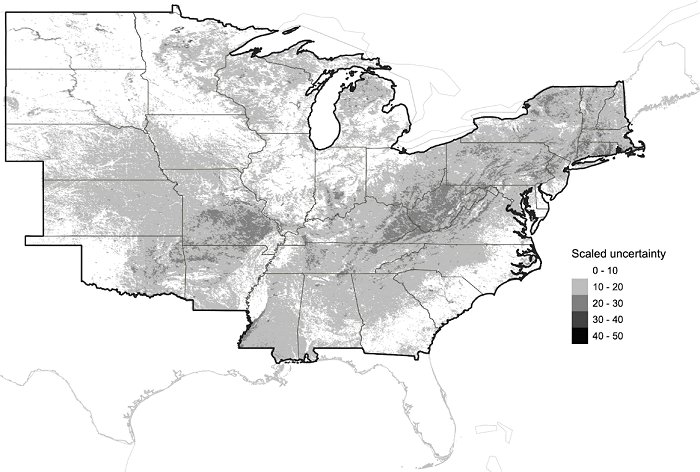
Map 2: Predicted Bee Richness Using Birds and Land Cover Variables
This map displays the scaled uncertainty associated with bee richness for each grid cell, where darker grays represent higher uncertainty.
Land Cover Data
We used the 2021 Cropland Data Layer from the U.S. Department of Agriculture, which provides remotely sensed, geo-referenced, and high-resolution (30-m) information about crops and land cover categories. After reducing and combining crop and land cover categories, following the methods outlined in Koh et al., 2016, we calculated the percentage of 3×3 km grids that were covered by the 21 most relevant and common land cover and crop categories.
Habitat and Landscape Trends
Understanding how conditions may be changing for a given species or group of species is important for guiding and prioritizing conservation efforts. We extended the methodology used to construct our 2021 prediction of bee richness (see manuscript) to estimate how landscape conditions for bees have changed from 2007-2021. We did this by (1) calculating abundance in 2007 for our bird species using eBird Status and Trends data products (abundance from 2021 and trends from 2007-2021) with a reverse compound interest rate formula and (2) integrating data from the 2008 Cropland Data Layer, which was the earliest available year for Cropland data in our study region. Those data were plugged into our original model to predict bee richness in 2007. We then compared the 2007 and 2021 estimates of bee richness to determine if landscape conditions associated with bee richness deteriorated, remained stable, or improved from 2007 to 2021.
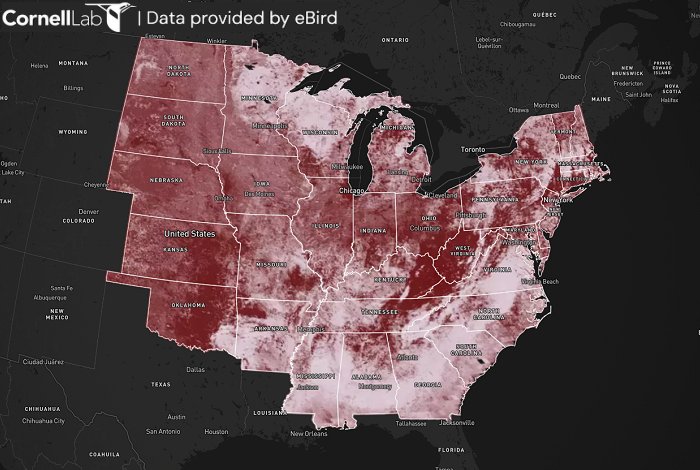
Map 3: Predicted Trends in Landscape Conditions for Bees:
This map shows the predicted changes in landscape conditions for wild bees between 2007-2021. Areas that predict improvements in landscape conditions may be on the right track for bee conservation, whereas those predicting that conditions have worsened may require restoration or action to prevent further deterioration.
(View interactive map on Wild Bee Diversity Prediction Tool page and click “Conditions”)
Limitations
In an ideal world, we would have sufficient field data on bees to assess their populations and guide conservation efforts. As bee experts continue to work hard to collect these data, we can turn to ecological indicators to help fill information gaps. Though indicators can be useful in situations with limited data on the species or group of interest, they have limitations. Most importantly, indicators can be regarded as “stop-gap measures” or “best guesses” based on known ecological relationships and existing surrogate data sources. The eBird bee indicator uses land cover and bird data to predict the species richness of wild bees and how conditions may have changed for bees since 2007. The indicator can help to identify a course of action expected to benefit bees. However, we strongly recommend on-the-ground monitoring of bees whenever possible.
Please keep in mind that ecological indicators provide evidence-based “best guesses” that can help to guide conservation in the absence of bee data. Please consult with regional or local experts and/or use of local data sources whenever possible. In addition, please support bee monitoring programs and the important work of experts who study and conserve bees.
Something else to keep in mind is that species richness, or the number of bee species, does not necessarily reflect the conservation value of a location for wild bees. An area with low richness, for example, may be essential for a specialized, threatened, or endemic bee species, whereas an area with high richness may be comprised of generalist, common, or abundant species of lower conservation concern.